spafe.fbanks.gammatone_fbanks
based on https://github.com/mcusi/gammatonegram/
-
spafe.fbanks.gammatone_fbanks.compute_gain(fcs, B, wT, T)[source]¶ Compute Gaina and matrixify computation for speed purposes.
Parameters: - fcs (array) – center frequencies in
- B (array) – bandwidths of the filters.
- wT (array) – corresponds to (omega) * T = 2 * pi * freq * T used for the frequency domain computations.
- T (float) – periode in seconds aka inverse of the sampling rate.
Returns: a 2d numpy array representing the filter gains. a 2d array A used for final computations.
-
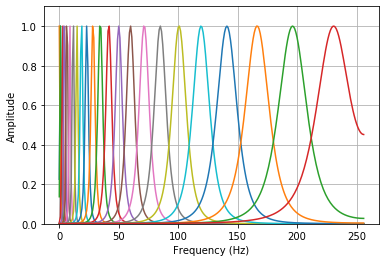
spafe.fbanks.gammatone_fbanks.gammatone_filter_banks(nfilts=20, nfft=512, fs=16000, low_freq=None, high_freq=None, scale='contsant', order=4)[source]¶ Compute Gammatone-filterbanks. The filters are stored in the rows, the columns correspond to fft bins.
Parameters: - nfilts (int) – the number of filters in the filterbank. (Default 20)
- nfft (int) – the FFT size. (Default is 512)
- fs (int) – sample rate/ sampling frequency of the signal. (Default 16000 Hz)
- low_freq (int) – lowest band edge of mel filters. (Default 0 Hz)
- high_freq (int) – highest band edge of mel filters. (Default samplerate/2)
- scale (str) – choose if max bins amplitudes ascend, descend or are constant (=1). Default is “constant”
- order (int) – order of the gammatone filter. Default is 4.
Returns: a numpy array of size nfilts * (nfft/2 + 1) containing filterbank. Each row holds 1 filter.
-
spafe.fbanks.gammatone_fbanks.generate_center_frequencies(min_freq, max_freq, nfilts)[source]¶ Compute center frequencies in the ERB scale.
Parameters: - min_freq (int) – minimum frequency of the center frequencies domain.
- max_freq (int) – maximum frequency of the center frequencies domain.
- nfilts (int) – number of filters, that is equivalent to the number of center frequencies to compute.
Returns: an array of center frequencies.
Example:
import matplotlib.pyplot as plt
from spafe.fbanks import gammatone_fbanks

# compute fbanks
fbanks = gammatone_fbanks.gammatone_filter_banks(nfilts=24, nfft=512, fs=16000)

# plot fbanks
for i in range(len(fbanks)):
    plt.plot(fbanks[i])
    plt.ylim(0, 1.1)
    plt.grid(True)
    plt.ylabel(ylabel)
    plt.xlabel(xlabel)
    plt.show()