spafe.fbanks.mel_fbanks
-
spafe.fbanks.mel_fbanks.inverse_mel_filter_banks(nfilts=20, nfft=512, fs=16000, low_freq=0, high_freq=None, scale='constant')[source]¶ Compute inverse Mel-filterbanks. The filters are stored in the rows, the columns correspond to fft bins.
Parameters: - nfilt (int) – the number of filters in the filterbank. (Default 20)
- nfft (int) – the FFT size. (Default is 512)
- fs (int) – sample rate/ sampling frequency of the signal. (Default 16000 Hz)
- low_freq (int) – lowest band edge of mel filters. (Default 0 Hz)
- high_freq (int) – highest band edge of mel filters. (Default samplerate/2)
- scale (str) – choose if mx bins amplitudes sum up to one or are constants. Default is “const”
Returns: a numpy array of size nfilt * (nfft/2 + 1) containing filterbank. Each row holds 1 filter.
-
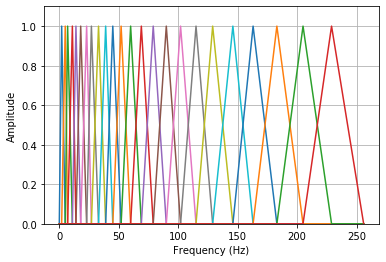
spafe.fbanks.mel_fbanks.mel_filter_banks(nfilts=20, nfft=512, fs=16000, low_freq=0, high_freq=None, scale='constant')[source]¶ Compute Mel-filterbanks.The filters are stored in the rows, the columns correspond to fft bins.
Parameters: - nfilts (int) – the number of filters in the filterbank. (Default 20)
- nfft (int) – the FFT size. (Default is 512)
- fs (int) – sample rate/ sampling frequency of the signal. (Default 16000 Hz)
- low_freq (int) – lowest band edge of mel filters. (Default 0 Hz)
- high_freq (int) – highest band edge of mel filters. (Default samplerate/2)
- scale (str) – choose if mx bins amplitudes sum up to one or are constants. Default is “constant”
Returns: a numpy array of size nfilts * (nfft/2 + 1) containing filterbank. Each row holds 1 filter.
Example:
import matplotlib.pyplot as plt
from spafe.fbanks import mel_fbanks

# compute fbanks
fbanks = mel_fbanks.mel_filter_banks(nfilts=24, nfft=512, fs=16000)

# plot fbanks
for i in range(len(fbanks)):
    plt.plot(fbanks[i])
    plt.ylim(0, 1.1)
    plt.grid(True)
    plt.ylabel(ylabel)
    plt.xlabel(xlabel)
    plt.show()